

Ask what the percentage actually measures
AEC Magazine’s Tandem dashboards article discusses ways to examine model and asset information. A dashboard can help focus review, but a percentage needs a precise definition. The independent example here considers a structural information check. It is not a claim about any particular platform’s calculation. The essential question is whether a reported result describes the intended population and whether passing the rule means the information is useful.
Define the population before the rule
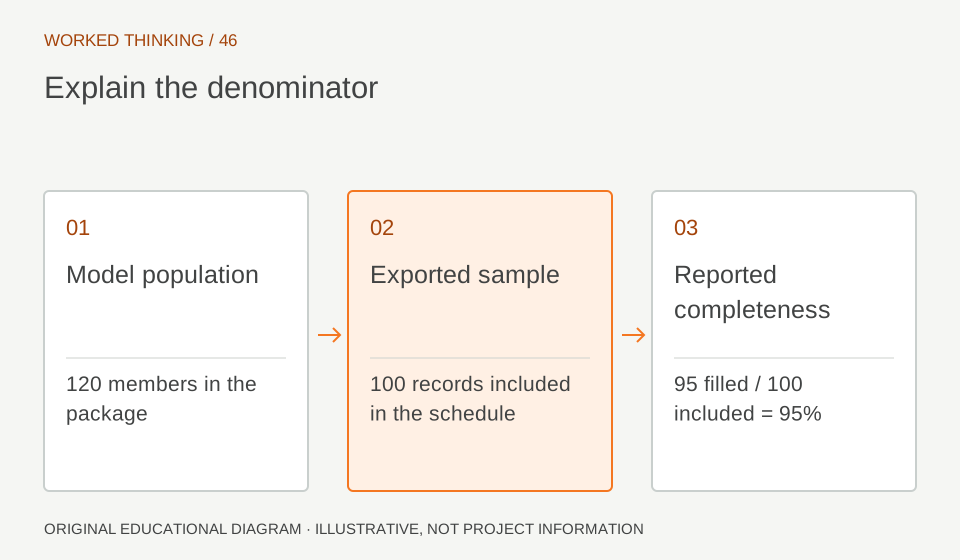
Suppose a package contains 120 structural members, but only 100 are included in an exported schedule. Reporting 95 populated material fields out of 100 schedule rows gives 95 percent. It does not establish that 95 percent of the entire package is complete. Explain the inclusion rule and reconcile the schedule against the model. If 20 members are legitimately excluded, name the reason and show that exclusion alongside the metric.
Distinguish presence from validity
A non-empty field may contain an obsolete code, a placeholder or a value in the wrong unit. Use separate checks for presence, permitted format, permitted values and relationship to the object. Do not call a presence check a quality check without explaining its narrow meaning. A dashboard can show several related indicators, but each should remain understandable and reproducible. Combining them into one score can conceal which part of the information failed.
Read diagram notes
- Model population
- 120 members in the package
- Exported sample
- 100 records included in the schedule
- Reported completeness
- 95 filled / 100 included = 95%
Give exceptions their own states
Separate missing, invalid, not applicable and not yet assessed. Define who is allowed to mark an item not applicable and what evidence is required. Do not convert unknown values to zero merely to simplify a chart. In a quantity schedule, zero can be a meaningful numerical value; missing information is a different condition. The distinction should remain visible in exported data as well as in the dashboard colours.
Make every total explainable
Provide a route from a summary tile to the affected records. Include object identifiers, the failed rule, observed value and model revision. A reviewer should be able to reproduce the result without relying on a screenshot of the dashboard. Record when the check ran and whether the model changed afterwards. A correct result for yesterday’s revision is not automatically evidence about today’s package.
Use the metric to direct work
Assign owners to unresolved groups and define how they are rechecked. Review whether the same exceptions recur because of a template, mapping or modelling issue. Do not reward a team for making a chart green by excluding difficult objects from the population. A useful metric helps prioritise investigation and reduces repeated errors. It should not become an incentive to hide uncertainty.
Publish a short metric definition
For each indicator, record its purpose, population, rule, unit, exception handling and refresh trigger. Add a small worked example so another reviewer can verify the arithmetic. Retain the underlying results with the accepted model revision. Confidence comes from a metric that can be explained and reproduced, not from a particularly polished shade of green.